Profiling🔗
General advice🔗
C3SE provides several tools to assist with profiling your applications. Profiling is extremely important to ensure that your code uses allocated resources in an optimal manner. Users are expected to profile their code and, if necessary, use the information from the profiler to optimize the code.
Warning: Profiling can incur a large overhead. Be prepared to increase your wall time!
Tools for profiling🔗
There are a variety of profiling tools, depending on your application, which type of information you require, and so on.
Scalene🔗
Scalene is a Python profiler with very little overhead, that combines line profiling, function profiling, CPU profiling, GPU profiling, and memory profiling into a single, compact utility. If you only want to use a single, simple profiling tool for Python, this is probably what you want to use. It can be loaded with, e.g.,
module load Scalene/1.5.20-GCCcore-11.3.0
For example, in suppose a developer want to know which functions inside the package mumott take the most time, and which parts of those functions take the most time. Using Scalene with
python -m scalene --profile-all --profile-only mumott reconstruction_pipelines.py
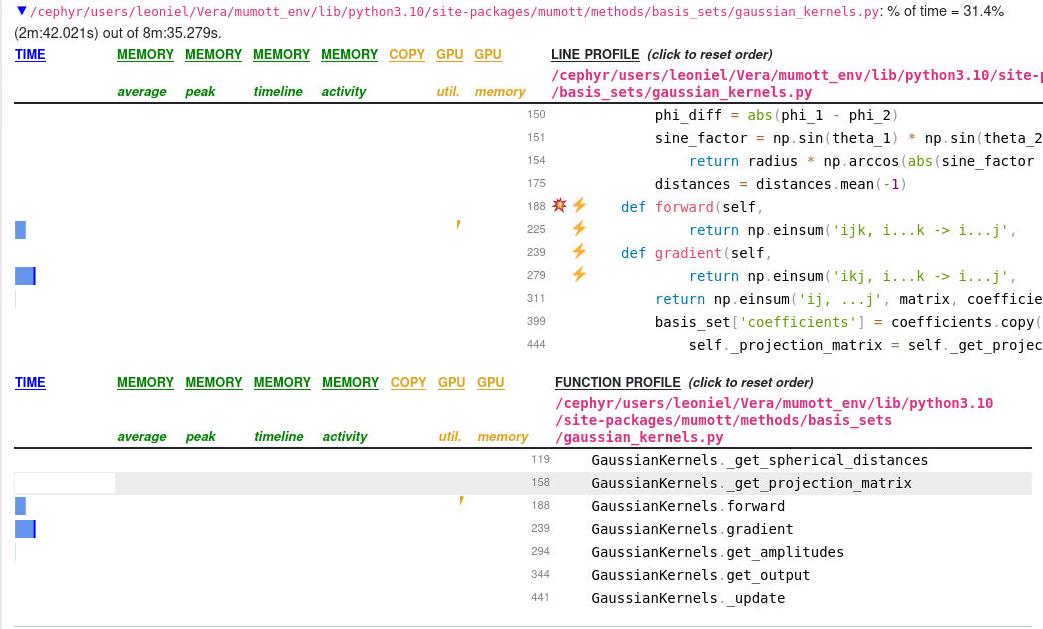
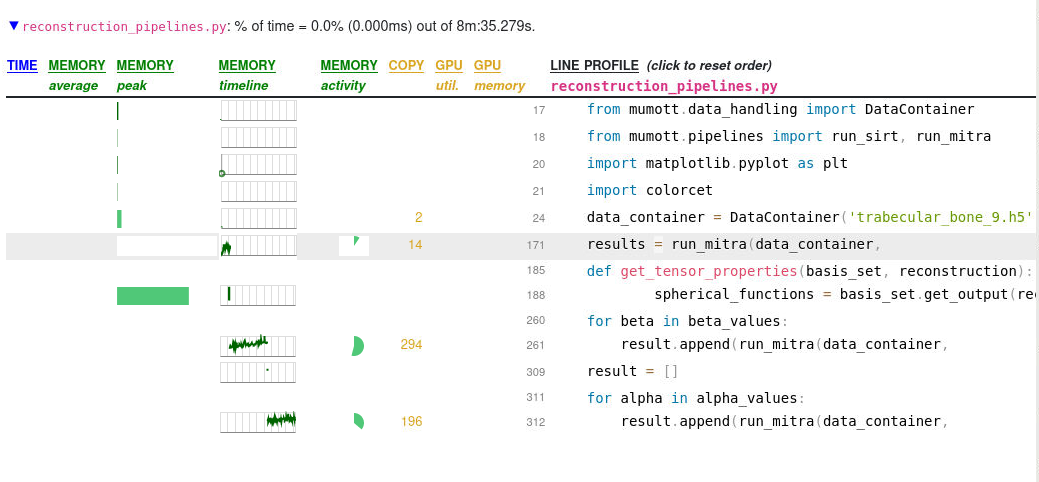
Here we can see for example that the GaussianKernels.gradient method takes a fair amount of time, and that almost all of that time is due to a complicated np.einsum(...) statement. On the top level we can see that memory usage peaks during the execution of basis_set.get_output() but in the function profiling, GaussianKernels.get_output() uses almost no time at all. If we were to run without the --profile-all and --profile-only statements, we would get information only on the top level, which is itself useful for many cases.
Scalene can also be run inside Jupyter notebooks.
TensorBoard🔗
TensorBoard is a visualisation toolkit bundled together with TensorFlow. TensorBoard is not only useful for understanding network topology but can also be used for profiling by leveraging the TensorFlow Profiler. To read more about TensorBoard please read our TensorBoard guide
You can also use the PyTorch profiler with TensorBoard. See official PyTorch documentation for instructions. PyTorch profiler and torch-tb-profiler to use profiler with TensorBoard are both bundled in the PyTorch-bundle modules.
NVIDIA Nsight🔗
NVIDIA provides their own profiling tools that we provide as as regular modules in the module system. This guide only provides a brief introduction to NVIDIA family of profiling tools, how to access them, and how you can get started.
The NVIDIA Nsight suite of profilers is the successor of nvprof and Visual
profiler starting at CUDA 10. Nsight allows for application and kernel
level profiling using either graphical user interface or command line interface
(CLI). NVIDIA Nsight is split into three tools of which two are provided in Alvis:
- NVIDIA Nsight Systems - for system-wide profiling across CPUs and GPUs.
- NVIDIA Nsight Compute - an interactive CUDA kernel-level profiling tool.
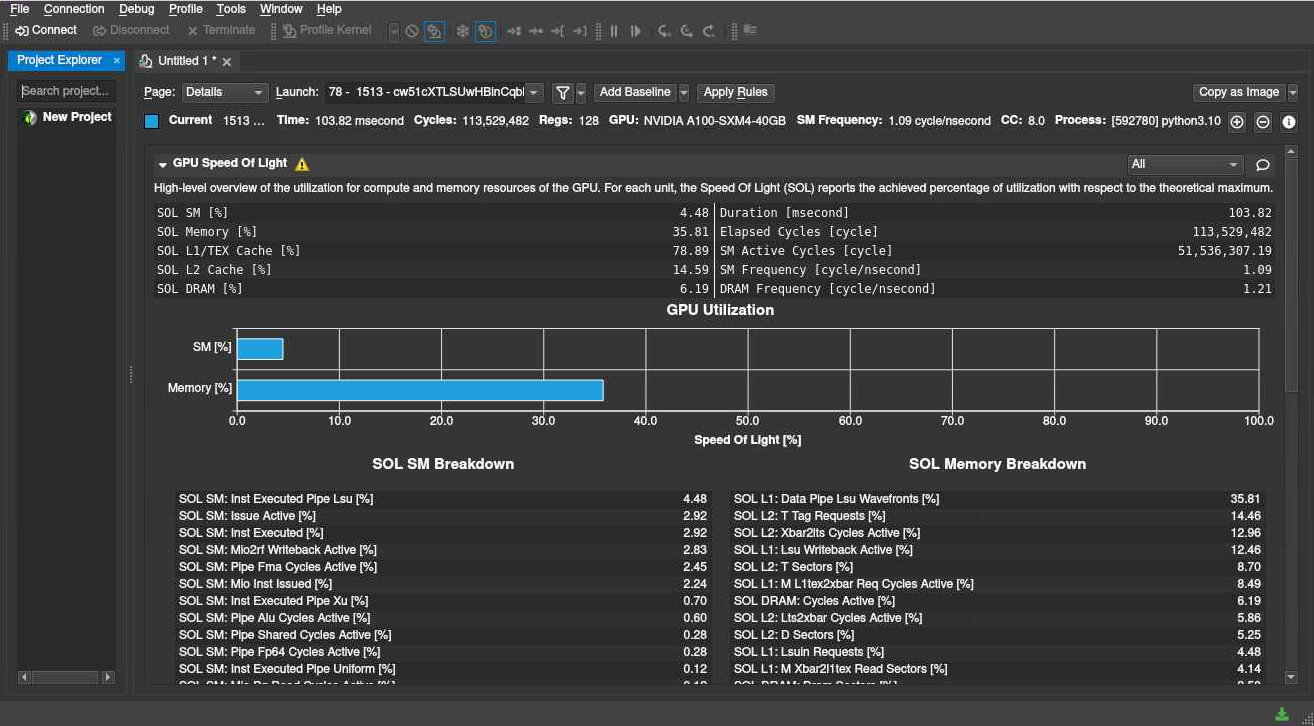
In this example of an Nsight Compute profiling, we can see that we are not using resources very optimally - our problem is somewhat too small to be efficiently run on an A100, but we can use the detailed information to optimize it as far as possible, run multiple jobs in parallel, etc. NVIDIA Nsight is best used interactively on a compute node, via the Vera and Alvis portals.
NVIDIA Nsight is included as part of CUDA since CUDA 11.1.0, To launch NVIDIA Nsight, simply select and load the cuda version of your choice.
module spider CUDA
module load CUDA/Your.Version
nsys-ui # launches Nsight System UI
ncu     # launches Nsight Compute CLI Profiler
The easiest way to ensure that everything is loaded correctly for profiling is to write a small run_program.sh bash script that loads all module, sets environmental variables, and executes the program. Then set the program to be executed by Nsight to sh and set the command line argument to run_program.sh. A run_program.sh file where we wish to profile a script that uses the aforementioned software mumott might look like
#!/bin/sh
# Load modules
module load h5py/3.7.0-foss-2022a tqdm/4.64.0-GCCcore-11.3.0 numba/0.56.4-foss-2022a-CUDA-11.7.0 scikit-image/0.19.3-foss-2022a
# Activate venv with `mumott` and additional modules for e.g. plotting
source mumott_env/bin/activate
# Run actual code to be profiled
python script_to_profile.py
The binaries nsys-ui ncu opens the graphical user interface. If you prefer to
work with the command line version you should launch ncu-cli instead. You can also use profiling tools in job submissions, using the nsys tool from NVIDIA Nsight:
$ srun -A NAISS2023-123-45 nsys -t cuda --stats cuda ./my_prog -n 1024 -l 3
nsys tracing CUDA calls (-t cuda) and
prints a performance summary at the end (--stats true) and profiles my_prog
with application specific arguments -n 1024 -l 3.