TensorFlow🔗
TensorFlow is a popular machine learning (ML) framework.
A common use case is to import TensorFlow as a module in Python.
It is then up to you as a user to write your particular ML application as a Python script using the tensorflow Python module functionality.
We provide precompiled optimised installations of TensorFlow in our tree of software modules.
Just like with most software, search for all available versions with module spider tensorflow.
If you want to run on CUDA accelerated GPU hardware, make sure to select a version with CUDA.
It is also possible to run TensorFlow using containers of which we provide many versions already centrally installed.
TensorFlow is heavily optimised for GPU hardware so we recommend using the CUDA version and to run it on the compute nodes equipped with GPUs. How to do this is described in our guide to running jobs.
After loading a TensorFlow module your environment is now configured to start calling TensorFlow from Python.
Here is a small test that prints the TensorFlow version available in your environment:
[cid@vera ~]$ python -c "import tensorflow as tf; print(tf.__version__)"
2.7.1
If you intend to run your calculations on GPU hardware it can be useful to check that TensorFlow detects the GPU hardware using its device_lib submodule.
Here is an example from a node equipped with a Nvidia Quadro GPU.
[cid@vera ~]$ python -c "from tensorflow.python.client import device_lib; device_lib.list_local_devices()"
...
2020-06-01 16:08:00.418439: I tensorflow/core/common_runtime/gpu/gpu_device.cc:1561] Found device 0 with properties:
pciBusID: 0000:3b:00.0 name: Quadro P2000 computeCapability: 6.1
coreClock: 1.4805GHz coreCount: 8 deviceMemorySize: 4.94GiB deviceMemoryBandwidth: 130.53GiB/s
...
2020-06-01 16:08:00.434406: I tensorflow/core/common_runtime/gpu/gpu_device.cc:1703] Adding visible gpu devices: 0
2020-06-01 16:08:00.434436: I tensorflow/stream_executor/platform/default/dso_loader.cc:44] Successfully opened dynamic library libcudart.so.10.1
2020-06-01 16:08:00.926384: I tensorflow/core/common_runtime/gpu/gpu_device.cc:1102] Device interconnect StreamExecutor with strength 1 edge matrix:
2020-06-01 16:08:00.926435: I tensorflow/core/common_runtime/gpu/gpu_device.cc:1108]      0
2020-06-01 16:08:00.926442: I tensorflow/core/common_runtime/gpu/gpu_device.cc:1121] 0:   N
2020-06-01 16:08:00.927639: I tensorflow/core/common_runtime/gpu/gpu_device.cc:1247] Created TensorFlow device (/device:GPU:0 with 4454 MB memory) -> physical GPU (device: 0, name: Quadro P2000, pci bus id: 0000:3b:00.0, compute capability: 6.1)
Dataloading🔗
You find our general dataloading tips at datasets.
Debugging🔗
TensorFlow is a complex software and the stochastic nature of many machine
learning algorithms together with the graph-based functioning of TensorFlow
makes debugging TensorFlow code more challenging than traditional imperative
code. For example, if you have previous debugging experience you are likely
aware that inserting print-statements at a few well-considered points in your
code can be a very efficient way to debug, however in TensorFlow this common
technique will not work in the general case due to the construction and
execution of graphs, which may ignore your print, or only execute it once
during graph initialisation. Even the common approach of attaching an
interactive (or step) debugger, such as gdb or pdb, have also limited
effectiveness in debugging TensorFlow code, due to the aforementioned reasons.
Of course, all hope is not lost - we just have to adjust our tools and
techniques.
This guide provides recommendations to ease the process of debugging TensorFlow 2 using Python and the bundled tools included in the TensorFlow installation available at C3SE.
- Eager vs. Graph execution
- Printing with
tf.print - Increase log severity
- Checkpoint your code
- Visualise using TensorBoard
- Check for
NaNand+-Infinity - Experimental API debugging
The examples shown here have not been tested in Jupyter notebooks. The code
should run but some output may not be visible in the Jupyter notebook. For
example, tf.print outputs to stderr, rather than the notebook. Keeps this in
mind if you are running Jupyter.
Debugging in TensorFlow, experimental APIs, and references to documentation
Debugging is about analysing code that does not behave in an
expected way. Debugging in TensorFlow could be to find numerical issues, for
example NaN or +- Infinity, finding mathematical modelling errors, as well
as trying to answer more broad questions Why is my prediction wrong? or Why
do the predictions differ between these two models?. This guide is limited
in-scope towards the lower-level details of your TensorFlow code, but debugging
covers a wide range of issues, and the tools and API for one type of debugging
might not fit the next.
TensorFlow is still under intense development and breaking public API changes
may occur between major versions. Debugging and profiling features both enter
and transition from the tf.experimental namespace. Always note what version
of TensorFlow you are running, and check what new features you get, and what
changes, by upgrading to the latest version.
Are you running on the GPU?
Are you reading this guide because you are unsure if you are using the GPUs? You can add the following line to the top of your program to find out what devices get mapped to your operations.
import tensorflow as tf

tf.debugging.set_log_device_placement(True)

def square(x):
  return tf.math.sqrt(x)

roots = square(tf.constant([2.0,4.0,8.0]))
$ python example.py
[...]
2021-03-09 09:28:44.485472: I tensorflow/core/common_runtime/gpu/gpu_device.cc:1402] Created TensorFlow device (/job:localhost/replica:0/task:0/device:GPU:3 with 13592 MB memory) -> physical GPU (device: 3, name: Tesla T4, pci bus id: 0000:af:00.0, compute capability: 7.5)
2021-03-09 09:28:44.486117: I tensorflow/core/common_runtime/process_util.cc:146] Creating new thread pool with default inter op setting: 2. Tune using inter_op_parallelism_threads for best performance.
2021-03-09 09:28:44.606224: I tensorflow/core/common_runtime/eager/execute.cc:611] Executing op Sqrt in device /job:localhost/replica:0/task:0/device:GPU:3
You will only get one print per eager execution (see further down this article for an explanation of eager vs. graph execution) you will thus not flood your logfiles if you do repeat tf calls.
Running the same example in graph mode using the tf.function decorator we
also get the graph placement appended to the end of the log.
x: (_Arg): /job:localhost/replica:0/task:0/device:CPU:0
Sqrt: (Sqrt): /job:localhost/replica:0/task:0/device:GPU:3
Identity: (Identity): /job:localhost/replica:0/task:0/device:GPU:3
identity_RetVal: (_Retval): /job:localhost/replica:0/task:0/device:GPU:3
Beware of the optimiser! Optimisation may alter your graphs!
The TensorFlow optimiser Grappler performs optimisations during graph execution which might result in some of your logged operations not being executed.
Read more about Grappler in the official documentation.
If you have discovered, or been notified, that your jobs are not efficient, we recommend you profile your application. Read our profiling guide for tips and documentation of available tools.
Eager vs. graph execution🔗
TensorFlow for most long-running and non-trivial training cases works by
constructing and executing graphs. This makes the well-known debugging
techniques (such as printing or using a step debugger) not very useful as you
are most likely interested in actual values during execution rather than their
symbolic representation, which is what you will see if you use e.g. python
print or attach pdb.
Tensor(“MatMul:0”, shape = (2,2), dtype = float32);
print would produce. In eager
execution the output would include the values as well:
tf.Tensor( [ [ 1337.0 1.0] [ 1.0 1337.0] ], shape= (2,2), dtype = floatt32)
So - we conclude that TensorFlow supports two different types of execution: eager and graph. Eager execution is basically operation-by-operation execution, as you would expect from working with any imperative coding language, while graph execution (that may take place in native code) works by constructing (known as tracing) and executing a graph. Eager execution is in general (but not always) slower but easier to debug compared to graph execution, hence the saying code with eager execution, run with graphs. As of TensorFlow 2.0 the default execution is eager, but you may find it useful to switch between the two modes during debugging. It only requires a few changes to the code.
Assume the following very simple function sqrt.
import tensorflow as tf

def sqrt(x):
    return tf.math.sqrt(x)

x = tf.constant([1.0, 2.0, 3.0])
x_sqrt = sqrt(x)
import tensorflow as tf

def sqrt(x):
    return tf.math.sqrt(x)

x = tf.constant([1.0, 2.0, 3.0])
x_sqrt = sqrt(x)
tf_sqrt = tf.function(sqrt)
sqrt in a tf.function call. It is
also common to see functions wrapped using the tf.function decorator.
import tensorflow as tf
@tf.function
def sqrt(x):
    return tf.math.sqrt(x)
A TensorFlow function runs the decoration function, when possible, as a TensorFlow graph. This has the side effect that any print statements included in the function would only get executed once as the graph is constructed.
Read more about tf.function in the
official documentation.
You can turn all supported calls to tf.graph into eager mode by setting
tf.config.run_functions_eagerly(True). In our simple example above there is
little benefit, but for a function that iterates it can be useful to print (or
checkpoint) the intermediate values.
Printing with tf.print🔗
You should substitute Python print with tf.print to print the actual
Tensor values during graph execution. Internally tf.print works by appending
a pair of nodes (String and PrintV2) to graph. As in traditional debugging,
adding prints may work if the code is small or you already have gathered
enough information to know roughly where the problem is. Adding tf.print to
every tensor in your code is not effective.
@tf.function
def my_func(x):
  for i in range(x):
    intermediate = tf.math.reduce_sum(x) + x[i] + pi
    print(intermediate)    # Symbolic representation only (printed during tracing!)
    tf.print(intermediate) # Prints the actual tensor values
Read more about tf.print in the
official documentation.
Check for NaN and +-Infinity🔗
TensorFlow 2.4.1 introduced tf.debugging.enable_check_numerics that when
activated will stop execution as soon as a tensor contains Infinity or NaN.
The call introduces numerical checks in your graph - overhead - and thereby
extending your runtime and memory requirements. It should only be set during
debugging.
This contrived example illustrates how a +Inf is caught and reported.
import tensorflow as tf

tf.debugging.enable_check_numerics(False) # Numeric checking is disabled

@tf.function
def weighted_normalized(vec):
  eps = tf.constant(0.005)
  res = vec / (tf.math.reduce_sum(vec) + eps)
  return res

# This is fine.
vec = tf.constant([0.0, 1.0, 2.0, 3.0])
wn_vec = weighted_normalized(vec) # [0 0.166527897 0.333055794 0.499583662])

# This is not fine... but with numeric checking disabled it will not be caught.
vec2 = tf.constant([-0.005, 0])
wn_vec2 = weighted_normalized(vec2) # [-inf nan] <-- NOT OK
If we run the above we get no indications that something is wrong even though
the second tensor contains [-inf nan]. If we re-run with
tf.debugging.enable_check_numerics(True) we get the following printed to stdout.
Traceback (most recent call last):
  File "test_tf.check_numerics", line 22, in <module>
    wn_vec2 = weighted_normalized(vec2) # [-inf nan] <-- NOT OK
  File "/apps/Alvis/software/MPI/GCC-CUDA/9.3.0-11.0.2/OpenMPI/4.0.3/TensorFlow/2.3.1-Python-3.8.2/lib/python3.8/site-packages/tensorflow/python/eager/def_function.py", line 780, in __call__
    result = self._call(*args, **kwds)
  File "/apps/Alvis/software/MPI/GCC-CUDA/9.3.0-11.0.2/OpenMPI/4.0.3/TensorFlow/2.3.1-Python-3.8.2/lib/python3.8/site-packages/tensorflow/python/eager/def_function.py", line 814, in _call
    results = self._stateful_fn(*args, **kwds)
  File "/apps/Alvis/software/MPI/GCC-CUDA/9.3.0-11.0.2/OpenMPI/4.0.3/TensorFlow/2.3.1-Python-3.8.2/lib/python3.8/site-packages/tensorflow/python/eager/function.py", line 2829, in __call__
    return graph_function._filtered_call(args, kwargs)  # pylint: disable=protected-access
  File "/apps/Alvis/software/MPI/GCC-CUDA/9.3.0-11.0.2/OpenMPI/4.0.3/TensorFlow/2.3.1-Python-3.8.2/lib/python3.8/site-packages/tensorflow/python/eager/function.py", line 1843, in _filtered_call
    return self._call_flat(
  File "/apps/Alvis/software/MPI/GCC-CUDA/9.3.0-11.0.2/OpenMPI/4.0.3/TensorFlow/2.3.1-Python-3.8.2/lib/python3.8/site-packages/tensorflow/python/eager/function.py", line 1923, in _call_flat
    return self._build_call_outputs(self._inference_function.call(
  File "/apps/Alvis/software/MPI/GCC-CUDA/9.3.0-11.0.2/OpenMPI/4.0.3/TensorFlow/2.3.1-Python-3.8.2/lib/python3.8/site-packages/tensorflow/python/eager/function.py", line 545, in call
    outputs = execute.execute(
  File "/apps/Alvis/software/MPI/GCC-CUDA/9.3.0-11.0.2/OpenMPI/4.0.3/TensorFlow/2.3.1-Python-3.8.2/lib/python3.8/site-packages/tensorflow/python/eager/execute.py", line 138, in execute_with_callbacks
    tensors = quick_execute(op_name, num_outputs, inputs, attrs, ctx, name)
  File "/apps/Alvis/software/MPI/GCC-CUDA/9.3.0-11.0.2/OpenMPI/4.0.3/TensorFlow/2.3.1-Python-3.8.2/lib/python3.8/site-packages/tensorflow/python/eager/execute.py", line 59, in quick_execute
    tensors = pywrap_tfe.TFE_Py_Execute(ctx._handle, device_name, op_name,
tensorflow.python.framework.errors_impl.InvalidArgumentError:

!!! Detected Infinity or NaN in output 0 of graph op "RealDiv" (# of outputs: 1) !!!
  dtype: <dtype: 'float32'>
  shape: (2,)

  Input tensors (2):
         0: Tensor("vec:0", shape=(2,), dtype=float32)
         1: Tensor("add:0", shape=(), dtype=float32)
  Graph name: "weighted_normalized"

  Stack trace of op's creation ("->": inferred user code):
    + ... (Omitted 18 frames)
    + ...8/site-packages/tensorflow/python/framework/ops.py (L1949) __init__
    |   self._traceback = tf_stack.extract_stack()

 : Tensor had -Inf and NaN values
     [[node truediv/CheckNumericsV2 (defined at test_tf.check_numerics:10) ]] [Op:__inference_weighted_normalized_43]

Function call stack:
weighted_normalized
Which clearly says that we have numerical issues in the graph weighted_normalized.
Read more about tf.debugging.enable_check_numerics in the
official documentation
Increase logging🔗
Logfiles can be a rich source of information, and every now and then they contain just enough to point us in the right direction. TensorFlow, together with Keras, has many types of logs, for instance, autograph logs, model loss logs, summary usage logs, training metric logs etc. In general most logging facilities support different levels of severity (sometimes called levels). TensorFlow supports the following five standard severity levels, in order of least to most severe: Supported levels: * DEBUG * ERROR * FATAL * INFO * WARN
The most verbose setting is the least severe - i.e DEBUG level produces the
most output, and most will likely not be relevant.
The following example gets the TensorFlow log and sets it in the DEBUG level.
import tensorflow as tf
import logging

tf_logger = tf.get_logger("tensorflow") # Any name will work
tf_logger.setLevel(tf_logger.DEBUG)
Warning: Beware of large logs and save them in a NOBACKUP area or in tmpdir.
Read more about tf.get_logger in the
official documentation.
Checkpoint your code🔗
Long running cluster jobs that for whatever reason crashes is not only very
annoying but also wastes precious compute hours from your allocation. In the
case of TensorFlow crashes can be challenging to debug, especially if it is
due to numerical instabilities (although there are tricks to discover NaN and
+-Inf, as we will show) that appear far along in training. Checkpointing
allows you to regularly and automatically save the state of your model to disk.
If a crash occurs, you can debug or resume your job at the most recent (and
correct) checkpoint. It is thus recommended for several reasons that you
investigate how checkpointing fits your code - and TensorFlow offers a few options.
You should start by looking into tf.train.Checkpoint or the Keras callback
tf.keras.callbacks.ModelCheckpoint. If you checkpoint every hour, you can
begin your debugging at the latest one hour before the bug (or crash) began.
Here is an example
how checkpointing works in TensorFlow on the Alvis system.
Read more about checkpointing in the official documentation.
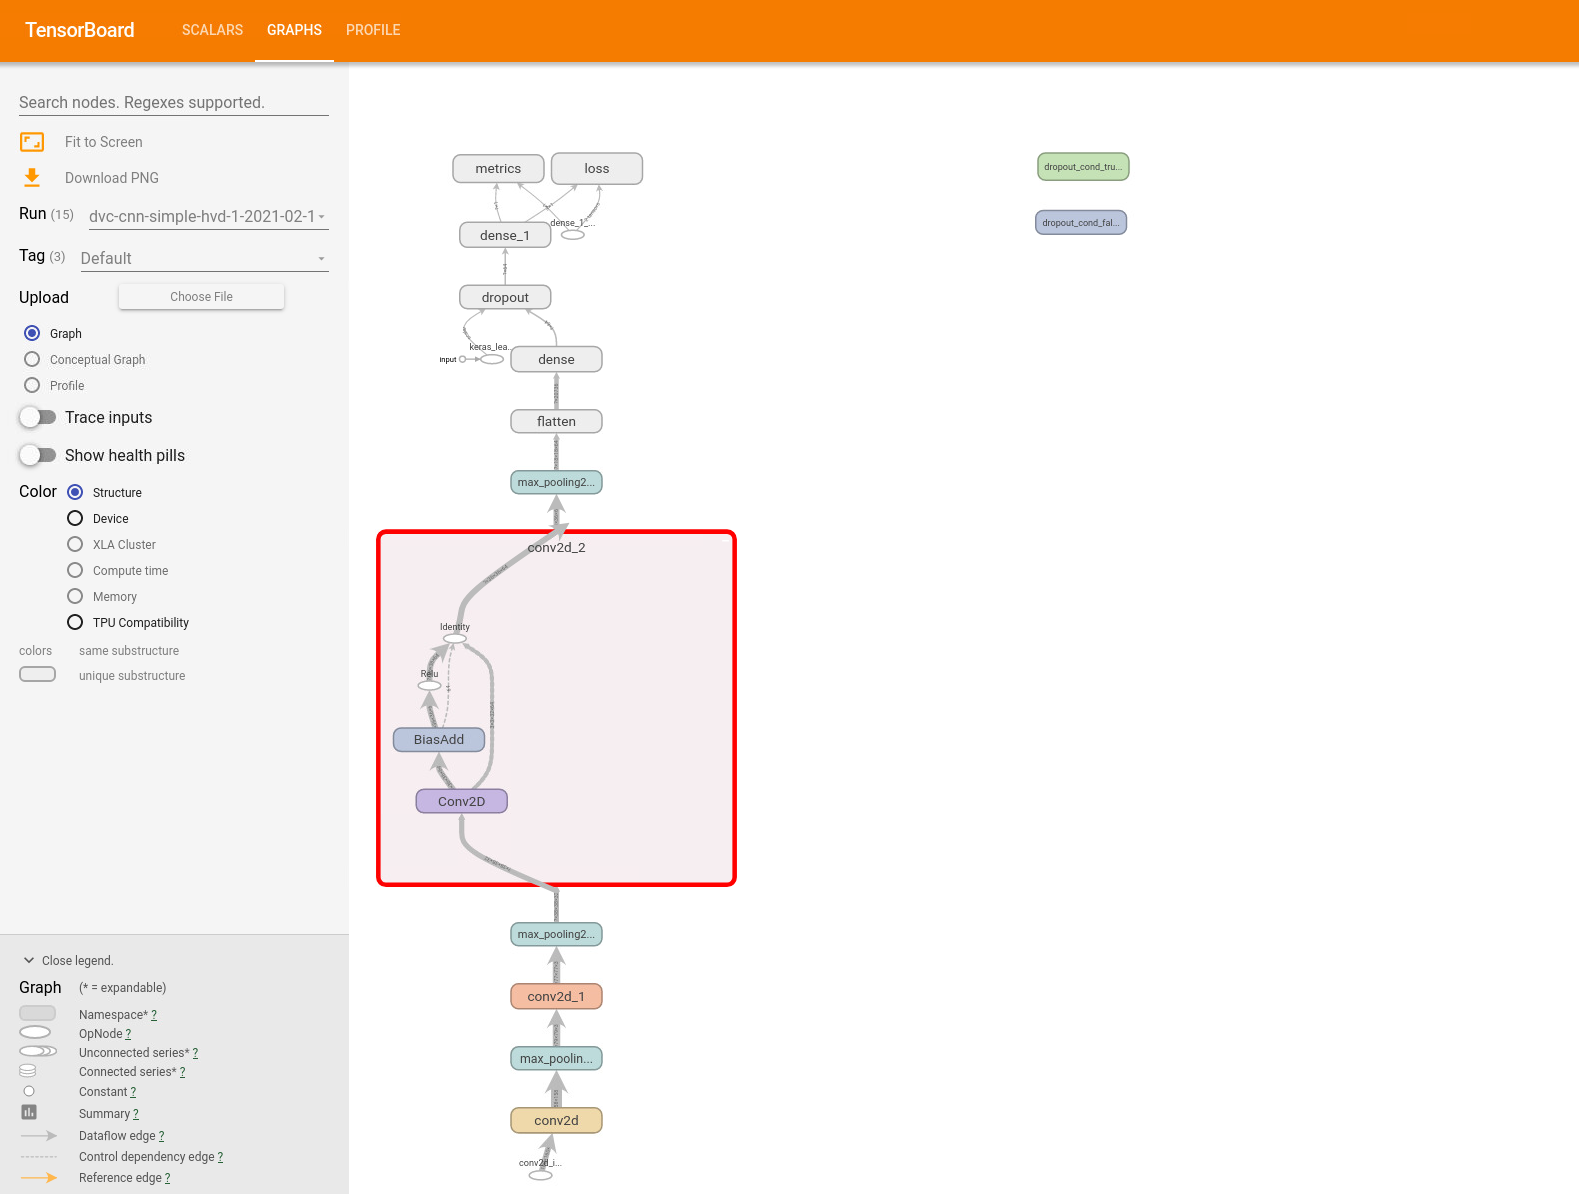
Visualise using TensorBoard🔗
TensorBoard is a visualisation toolkit that comes bundled with TensorFlow. TensorBoard can be used for many different types of debugging, and not exclusively for TensorFlow. For instance, you can visualise the resulting graph, find traces and profiling information.
 .
.
TensorBoard is interactive and you can inspect your graph in a browser. For more information about TensorBoard read our TensorBoard guide.
Experimental API debugging🔗
We finish with a recommendation to keep an eye in the experimental API for new features related to debugging. Note that the API that is marked as experimental may change with short notice, and may become dropped in later versions.
Warning: tf.debugging.experimental.enable_dump_debug_info as of TensorFlow
2.3 is marked as experimental. How you call it may change between versions.
Please consult the
documentation for tf.debugging
for the current way of using it for the version of TensorFlow you are running.
You can dump large amount of debug information to a directory using the
tf.debugging.experimental.enable_dump_debug_info() call at the start of your
program.
import tensorflow as tf

tf.debugging.experimental.enable_dump_debug_info(
    dump_root="logs/dbg",
    tensor_debug_mode="FULL_HEALTH",
    circular_buffer_size=-1)

# Rest of program
The option tensor_debug_mode in the above example is set to maximum
verbosity, producing information about each floating-dtype tensor including
counts of +- Inf and NaN. You can increase the amount of debug information
by increasing the circular_buffer_size. The value -1 disable the circular
buffer - and we keep all data. The debug data also includes events and
annotated source code tracing data. It is mean to be visualised using
TensorBoard.
You view the data by launching TensorBoard on the same machine were you dumped
the data. TensorBoard is bundled with TensorFlow. If you have loaded TensorFlow
from the module system you can launch TensorBoard using the tensorboard
command.
$ tensorboard --logdir logs/dbg
Read more about the experimental API in the official documentation
Reading datasets🔗
Machine learning datasets commonly can be made up from a multitude of files. In HPC environments these can be less than ideal. Reading (and writing) is generally a lot slower compared when done to multiple files compared to a single large files.
To get around this you should read directly from archives or if you are doing some preprocessing and are planning on using your data multiple, then you can save the preprocessed data into a few tfrecords instead.
To read directly from archives you can use the TensorFlow Datasets module
(module spider TensorFlow-Datasets). For example to read images:
import tensorflow_datasets as tfds

# Initialize to get access to method (we do not plan on downloading anything)
dl_manager = tfds.download.DownloadManager(download_dir='/tmp')

# Iterate over archive
path_to_archive = '/mimer/NOBACKUP/Datasets/Lyft-level5/Perception/train.tar'
image_feature = tfds.core.features.Image()
for filename, f in dl_manager.iter_archive(path_to_archive):
    if filename.endswith('.jpeg'):
        img = image_feature.decode_example(f.read())
        print(img.shape)