Introduction to Alvis
Chalmers e-Commons/C3SE
2025-01-15
Aims of this seminar
- Introduce the Alvis system
- Hardware
- Storage and filesystems
- Software and containers
- Job submissions
- Find recordings at: https://play.chalmers.se/playlist/dedicated/805345/0_4b57vifc/
- This presentation is available on the C3SE web page:
Overview
Alvis
Technical specifications
- NAISS resource dedicated to AI/ML research funded by KAW
- Consists of nodes accelerated with multiple GPUs
- For node details, see about Alvis
Eligibilitiy
- Swedish academic researcher as PI
- NAISS Small Compute: PI ≥ PhD-student
- NAISS Medium/Large Compute: PI ≥ Assistant Professor
- Workloads using GPUs
- Guide for getting access
- NAISS plans to discontinue Alvis 2026-06-30
GPU hardware details
| #GPUs | GPUs | Capability | CPU | Note |
|---|---|---|---|---|
| 44 | V100 | 7.0 | Skylake | |
| 160 | T4 | 7.5 | Skylake | |
| 332 | A40 | 8.6 | Icelake | No IB |
| 296 | A100 | 8.0 | Icelake | Fast Mimer |
| 32 | A100fat | 8.0 | Icelake | Fast Mimer |
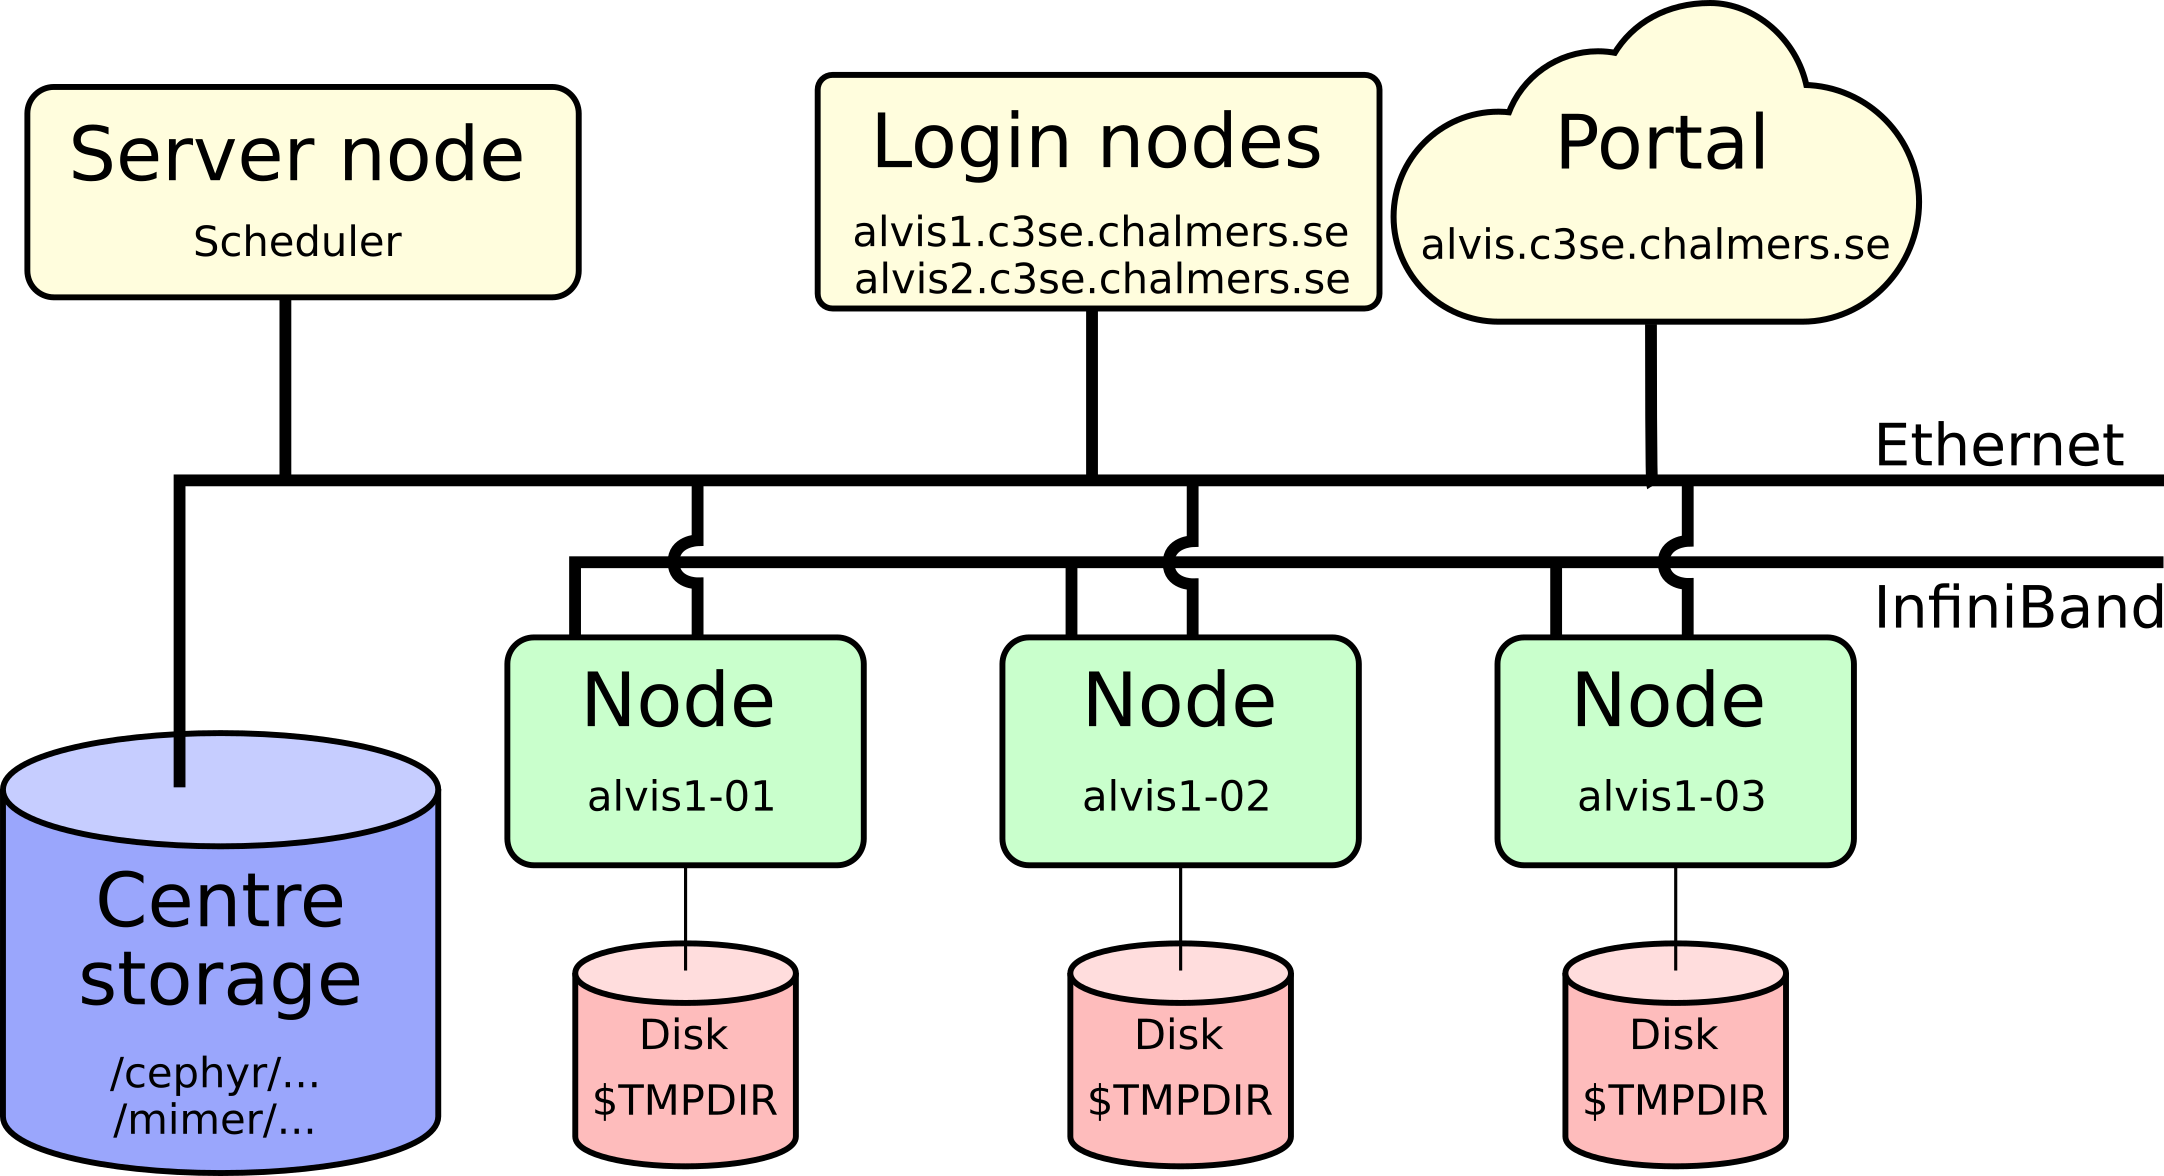
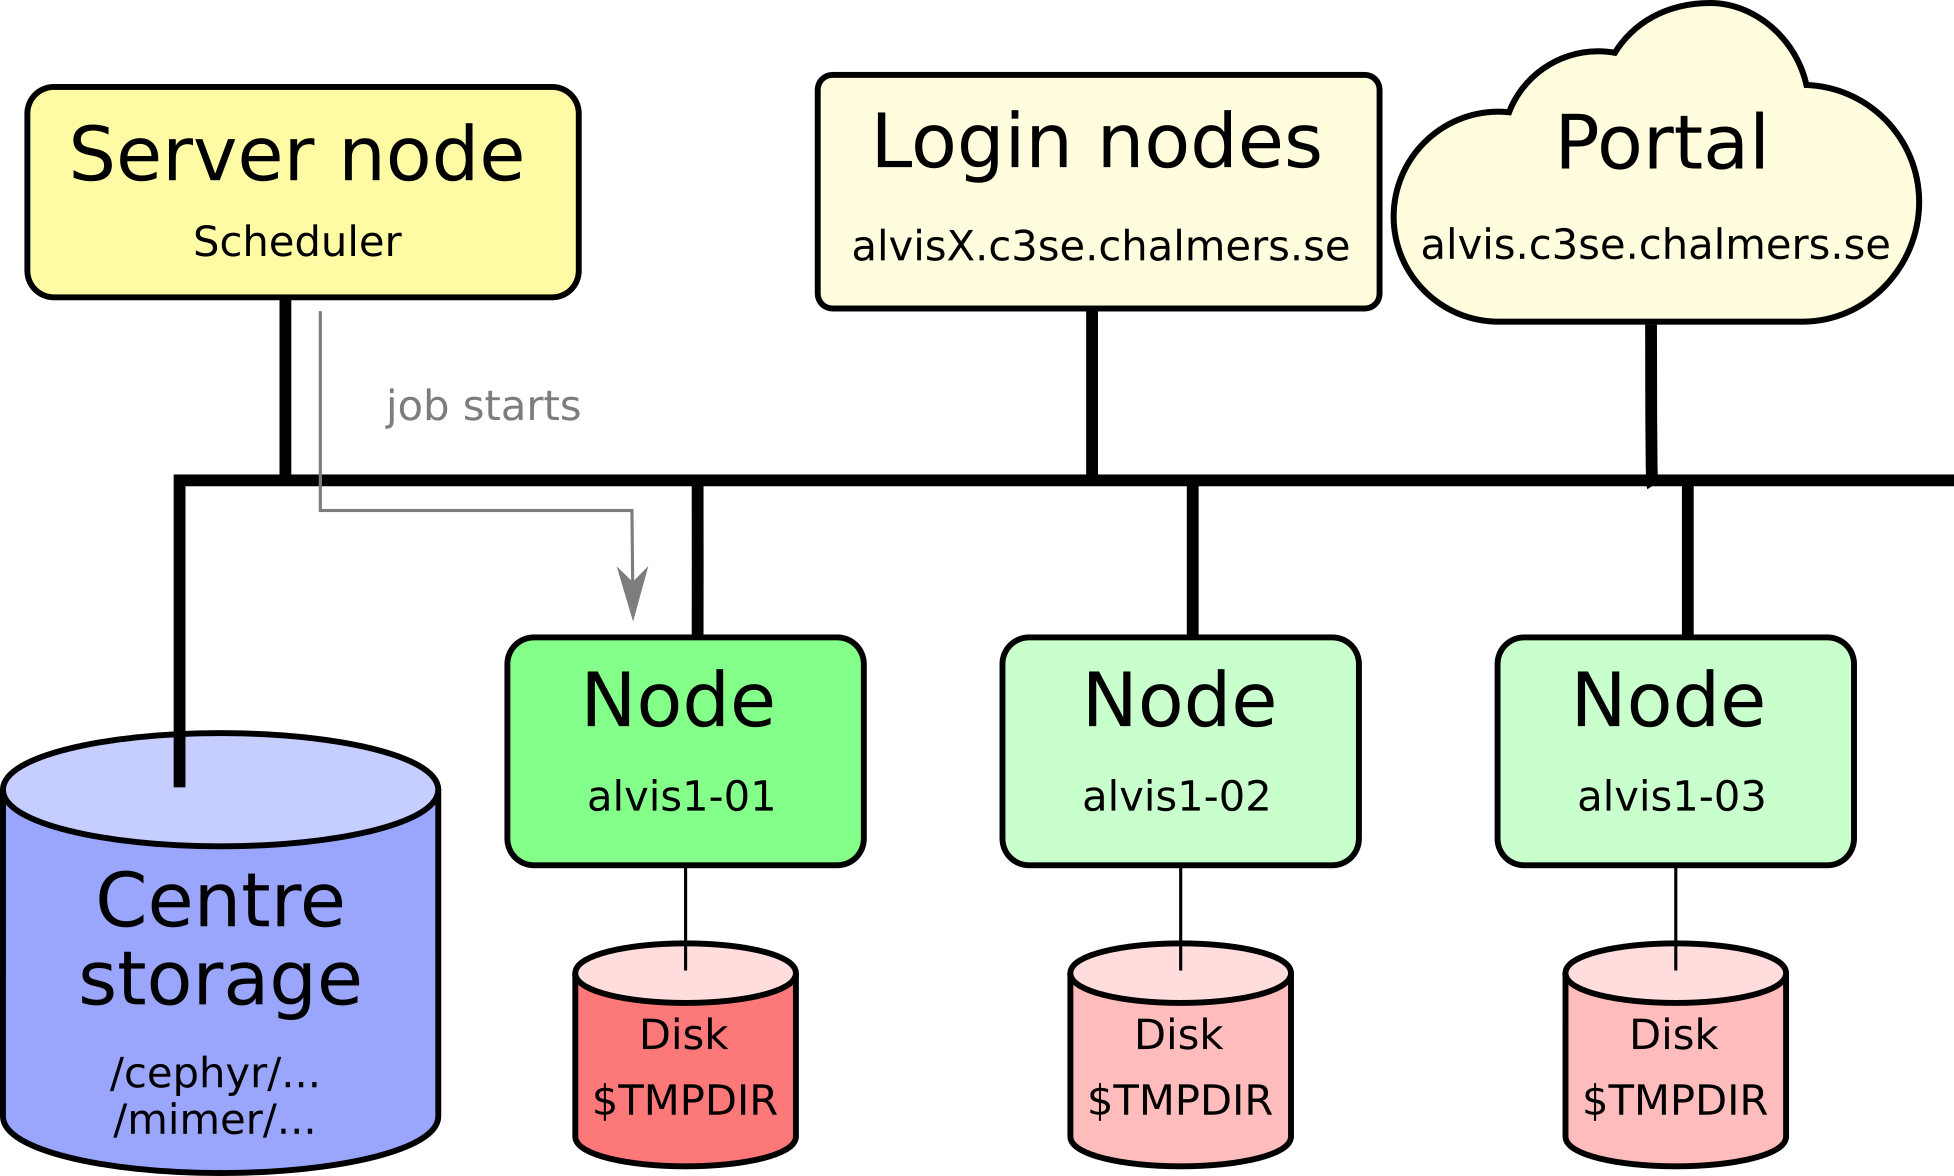
Cluster sketch
Connecting
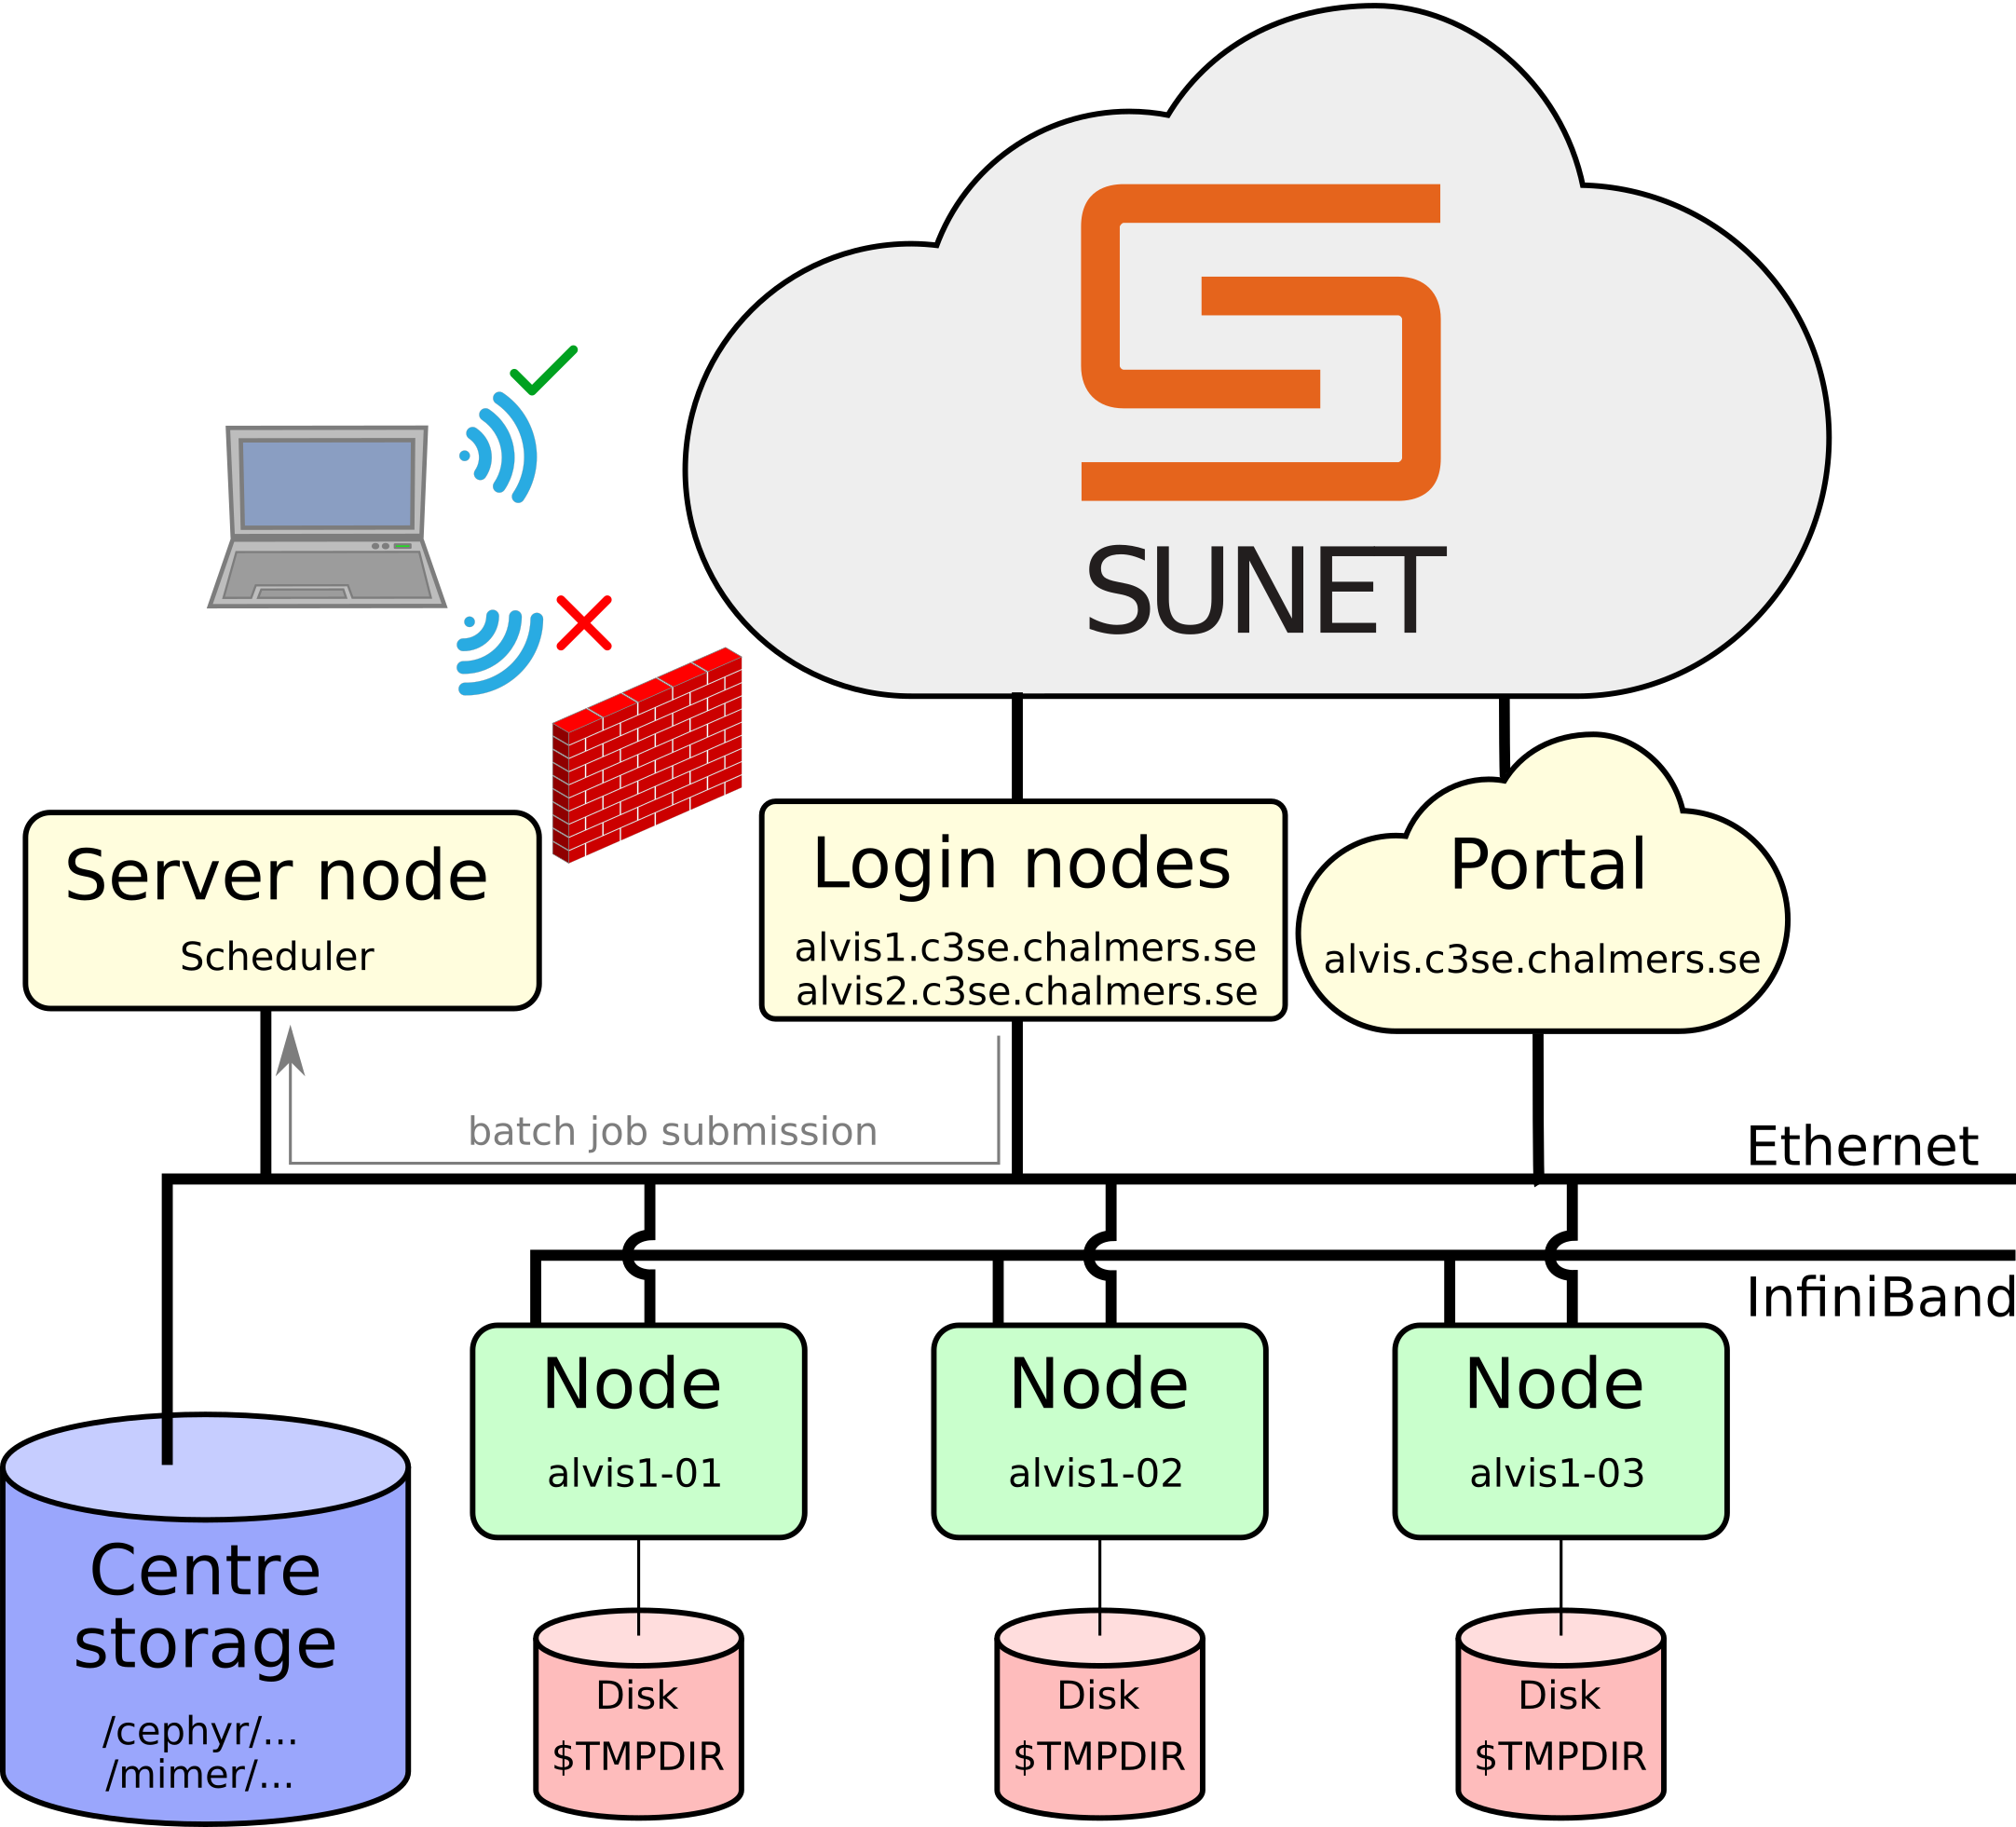
Firewall and VPN
Log-in nodes
alvis1.c3se.chalmers.sehas 4 T4 GPUs for light testing and debuggingalvis2.c3se.chalmers.seis dedicated data transfer node- Will be restarted from time to time
- Login nodes are shared resources for all users:
- don’t run jobs here,
- don’t use up too much memory,
- preparing jobs and
- light testing/debugging is fine
SSH - Secure Shell
ssh <CID>@alvis1.c3se.chalmers.se,ssh <CID>@alvis2.c3se.chalmers.se- Gives command line access to do anything you could possibly need
- If used frequently you can set-up a password protected SSH-key for convenience
Alvis Open OnDemand portal
- https://alvis.c3se.chalmers.se
- Browse files and see disk and file quota
- Launch interactive apps on compute nodes
- Desktop
- Jupyter notebooks
- MATLAB proxy
- RStudio
- VSCode
- Launch apps on log-in nodes
- TensorBoard
- Desktop
- See our documentation for more
Remote desktop
- RDP-based remote desktop solution on shared login nodes (use portal for heavier interactive jobs)
- In-house-developed web client:
- Can also be accessed via desktop clients such as Windows Remote Desktop Connection (Windows), FreeRDP/Remmina/krdc (Linux) and Windows App (Mac) at <alvis1.c3se.chalmers.se> and <alvis2.c3se.chalmers.se> (standard port 3389).
- Desktop clients tend to offer better quality and more ergonomic experiences.
- See the documentation for more details
Files and Storage
- Cephyr
/cephyr/, and Mimer/mimer/are parallel filesytems, accessible from all nodes.
Parallel filesystems
- Accessible from all servers
- Backed up home directory at
/cephyr/users/<CID>/Alvis(alt. use~) - Project storage at
/mimer/NOBACKUP/groups/<storage-name> - The
C3SE_quotashows you all your centre storage areas, usage and quotas.- On Cephyr see file usage with
where-are-my-files
- On Cephyr see file usage with
- File-IO is usually the limiting factor on parallel filesystems
- If you can deal with a few large files instead of many small, that is preferable
Transfering files
- See filesystem page for documentation, with examples on how to share files.
- Transfer via alvis2 (dedicated data transfer node)
- Same connection requirements as usual
- Command line tools like
scp,rsync,rclone - Graphical tools like CyberDuck and WinSCP
- Run transfer tools on your local machine
Editing files and traversing the filesystem
- Learn the common tools:
cd,pwd,ls,cp,mv,rsync,rmdir,mkdir,rm - Learn to use a command line editor:
nano,vim,emacs, …
Data policies
- Data deletion policy for storage projects.
- See NAISS UA for user data deletion.
Datasets
- We allowed, we provide popular datasets at
/mimer/NOBACKUP/Datasets/ - In all cases, only allowed use is for non-commercial, research applications
- Note that original provider may require you to cite some literature if you use if you use the dataset in your research
- It is your responsibility to make sure your use is compliant
- In some cases, a README file with information is found by the dataset
- A list of the currently available datasets and supplementary information can be found under datasets
- For details on transferring datasets to and from Alvis see, bulk data transfer page.
Software
- Our systems currently run Rocky Linux 8, which is an open-source version of Red Hat Enterprise Linux
- It’s not Ubuntu!
- Users do NOT have
sudorights! - You can’t install software using
apt-get! - The system installation is intentionally sparse; you access software via modules and containers.
Containers
- It is possible to run containers via Apptainer
- Apptainer is a fork off of Singularity
- No, it will not be possible to run docker, but you can easily convert docker containers to apptainer containers
- We provide some containers under
/apps/containers - Instructions on how to use build and use containers
- You can build your container on the log-in nodes with
apptainer build my_container.sif my_recipe.def
Modules
- A lot of software available in modules.
- Commercial software and libraries; MATLAB, CUDA, Nsight Compute and much more.
- Tools, compilers, MPI, math libraries, etc.
- Major version update of all software versions is done twice yearly
- 2022b: GCC 12.2.0, OpenMPI 4.1.4, CUDA 12.0.0, Python 3.10.8, …
- 2023a: GCC 12.3.0, OpenMPI 4.1.5, CUDA 12.1.1, Python 3.11.3, …
- 2023b: GCC 13.2.0, OpenMPI 4.1.6, CUDA 12.4.0, Python 3.11.5, …
- Mixing toolchains versions will not work
- Popular top level applications such as TensorFlow and PyTorch may be updated within a single toolchain version.
Toolchains
- Tip: You can test things out on the login node. Try loading and purging modules; changes are temporary.
- Putting load commands directly in your
~/.bashrcwill likely break some system utilities for you. module load Foo/1.2.3orml Foo/1.2.3for loadingmodule listormlto list all currently loaded modulesmodule spider Barorml spider Barfor searchingmodule keyword Barorml keyword Barfor searching keywords (e.g. extensions in python bundles)module purgeorml purgefor unloading all modules- Modules provide development information as well, so can be used as dependencies for builds.
- Flat module system.
Software installation
- We build a lot of modules and containers for general use upon request.
- We provide
pip,apptainer,conda, andvirtualenvso you can install your own Python packages locally.- See Python information on our homepage for examples.
- Do not use
pip install --user, this is likely to make a mess when used with any other approach and fill up your home directory quota quickly. - Be aware of your quota! Consider making a container if you need environments.
- You can use modules for linking to software you build yourself.
- Trying to mix conda, virtualenv, containers, and modules does not work well in general. Only exceptions are:
- Virtualenv on top of modules, OK
- Conda base environment inside miniforge containers, OK
Installing binary (pre-compiled) software
- Occasional issue is that software requires a newer glibc version. This is tied to the OS and can’t be upgraded.
- You can use an Apptainer container to wrap this for your software.
- Make sure to use binaries that are compiled optimised for the hardware.
- Alvis CPUs support up to AVX512.
- Difference can be huge. Example: Compared to our optimised NumPy builds, a generic x86 version from
pipup to ~9x slower on Vera.
- CPU: AVX512 > AVX2 > AVX > SSE > Generic instructions.
- GPU: Make sure you use the right CUDA compute capabilities for the GPU you choose.
Using GPUs
- Main workload should be on GPUs.
- Using existing frameworks (PyTorch, TensorFlow, JAX, …) is usually best
- Replace heavy NumPy/SciPy workloads with CuPY, see documentation
- Monitor jobs running new code to see that GPUs are used (
job_stats.py,nvidia-smi, …) - Consider what floating-point types you are using:
- lower precision is faster (but too low may impact results)
- float64 is very slow and typically not for machine learning
- float32 to TensorFloat32 or float16/bfloat16 can give substantial speed-up
- see some examples for matrix multiplication here
- Jobs allocating GPUs but barely using them may be terminated
- for light work-loads, T4 is our smallest GPU
Running jobs on Alvis
- Alvis is dedicated to AI/ML research which typically involves GPU-hungry computations; therefore, your job must allocate at least one GPU
- You only allocate GPUs (cores and memory is assigned automatically)
- Hyperthreading is disabled on Alvis
- Alvis comes in three phases (I, II, and III), and there is a variety in terms of:
- number of cores
- number and type of GPUs
- memory per node
- CPU architecture
SLURM
- Alvis runs the SLURM workload manager, a batch queuing software
- Allocations and usage is defined on a (NAISS) project level.
- Fairshare system; you can go over your monthly allocation but your past 30 days (“monthly”) rolling average affects your queue priority.
- For more details see Running jobs.
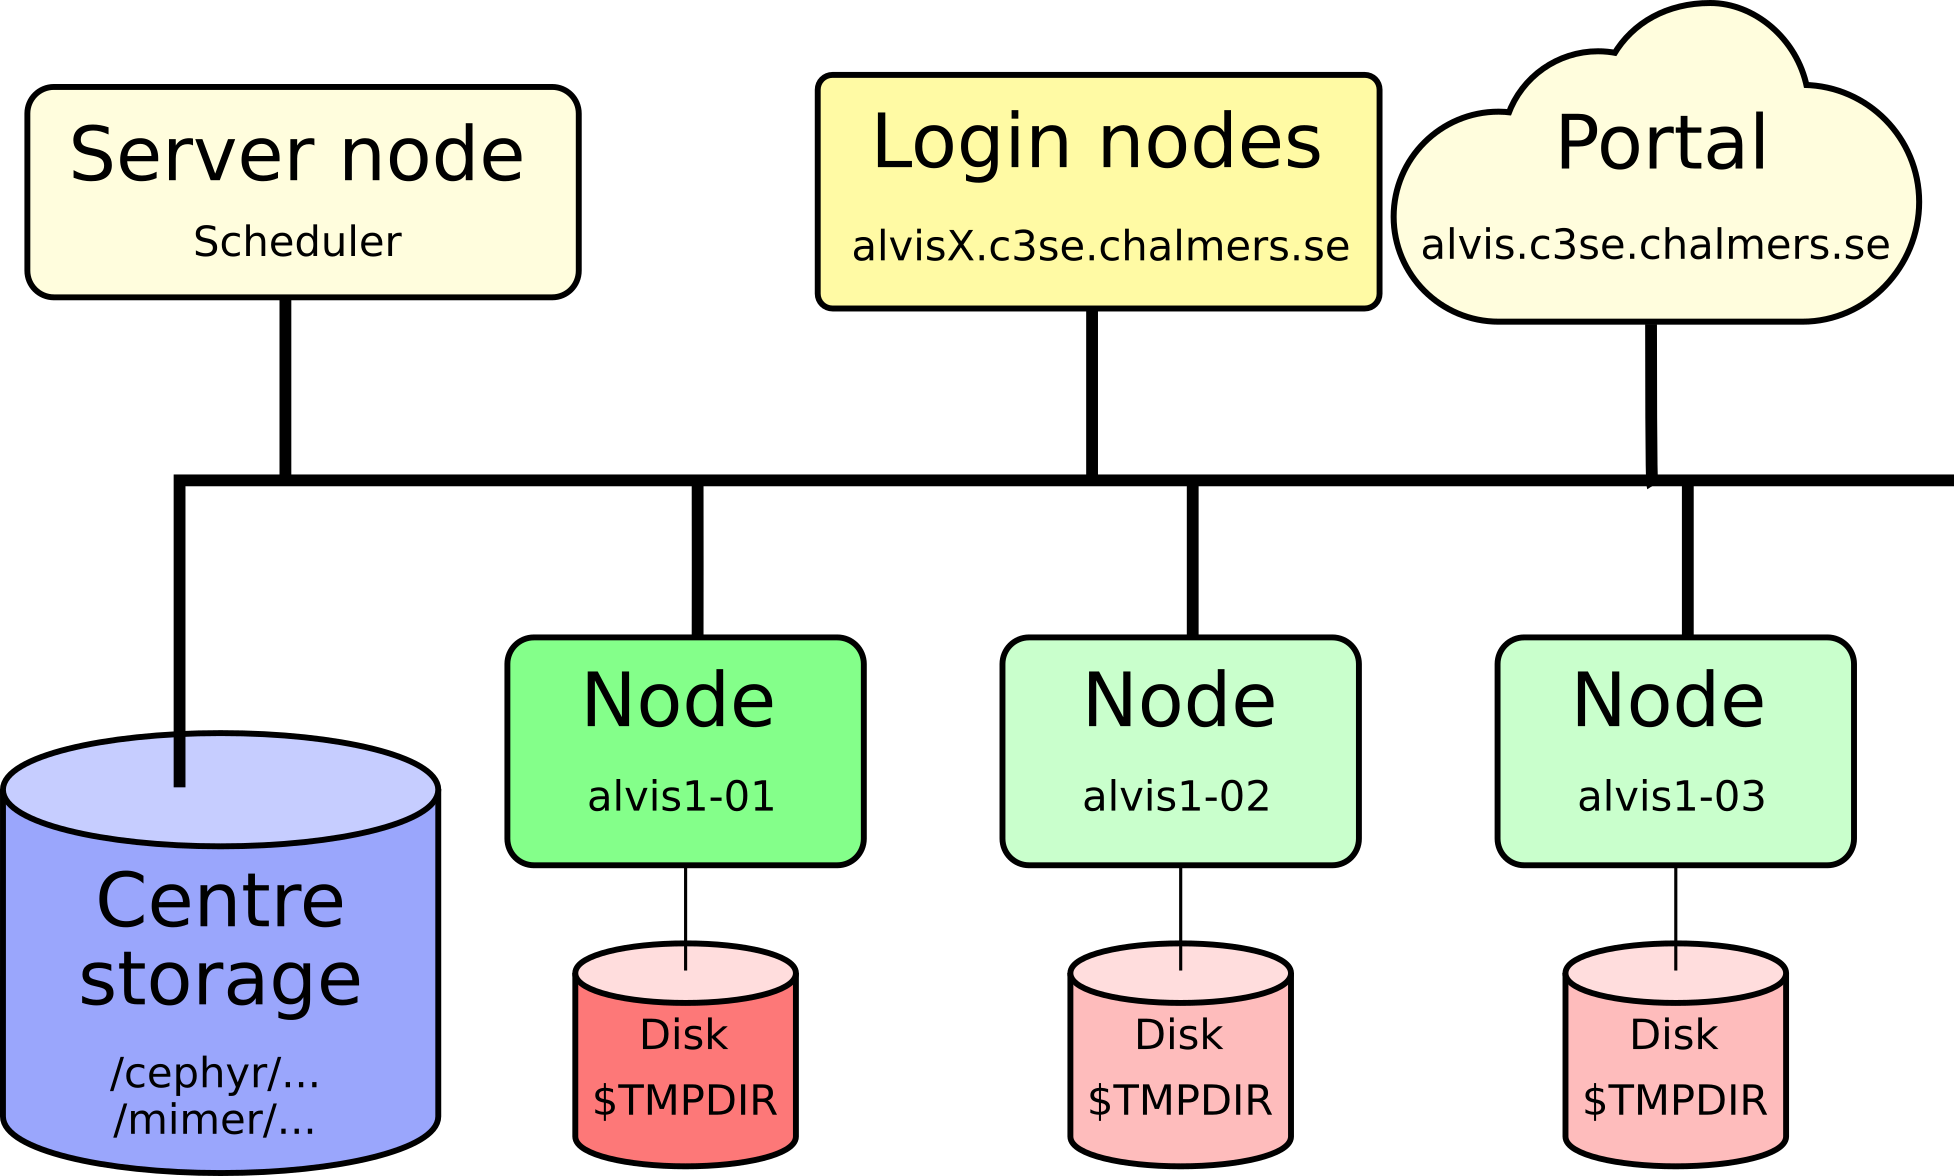
Working on the log-in node
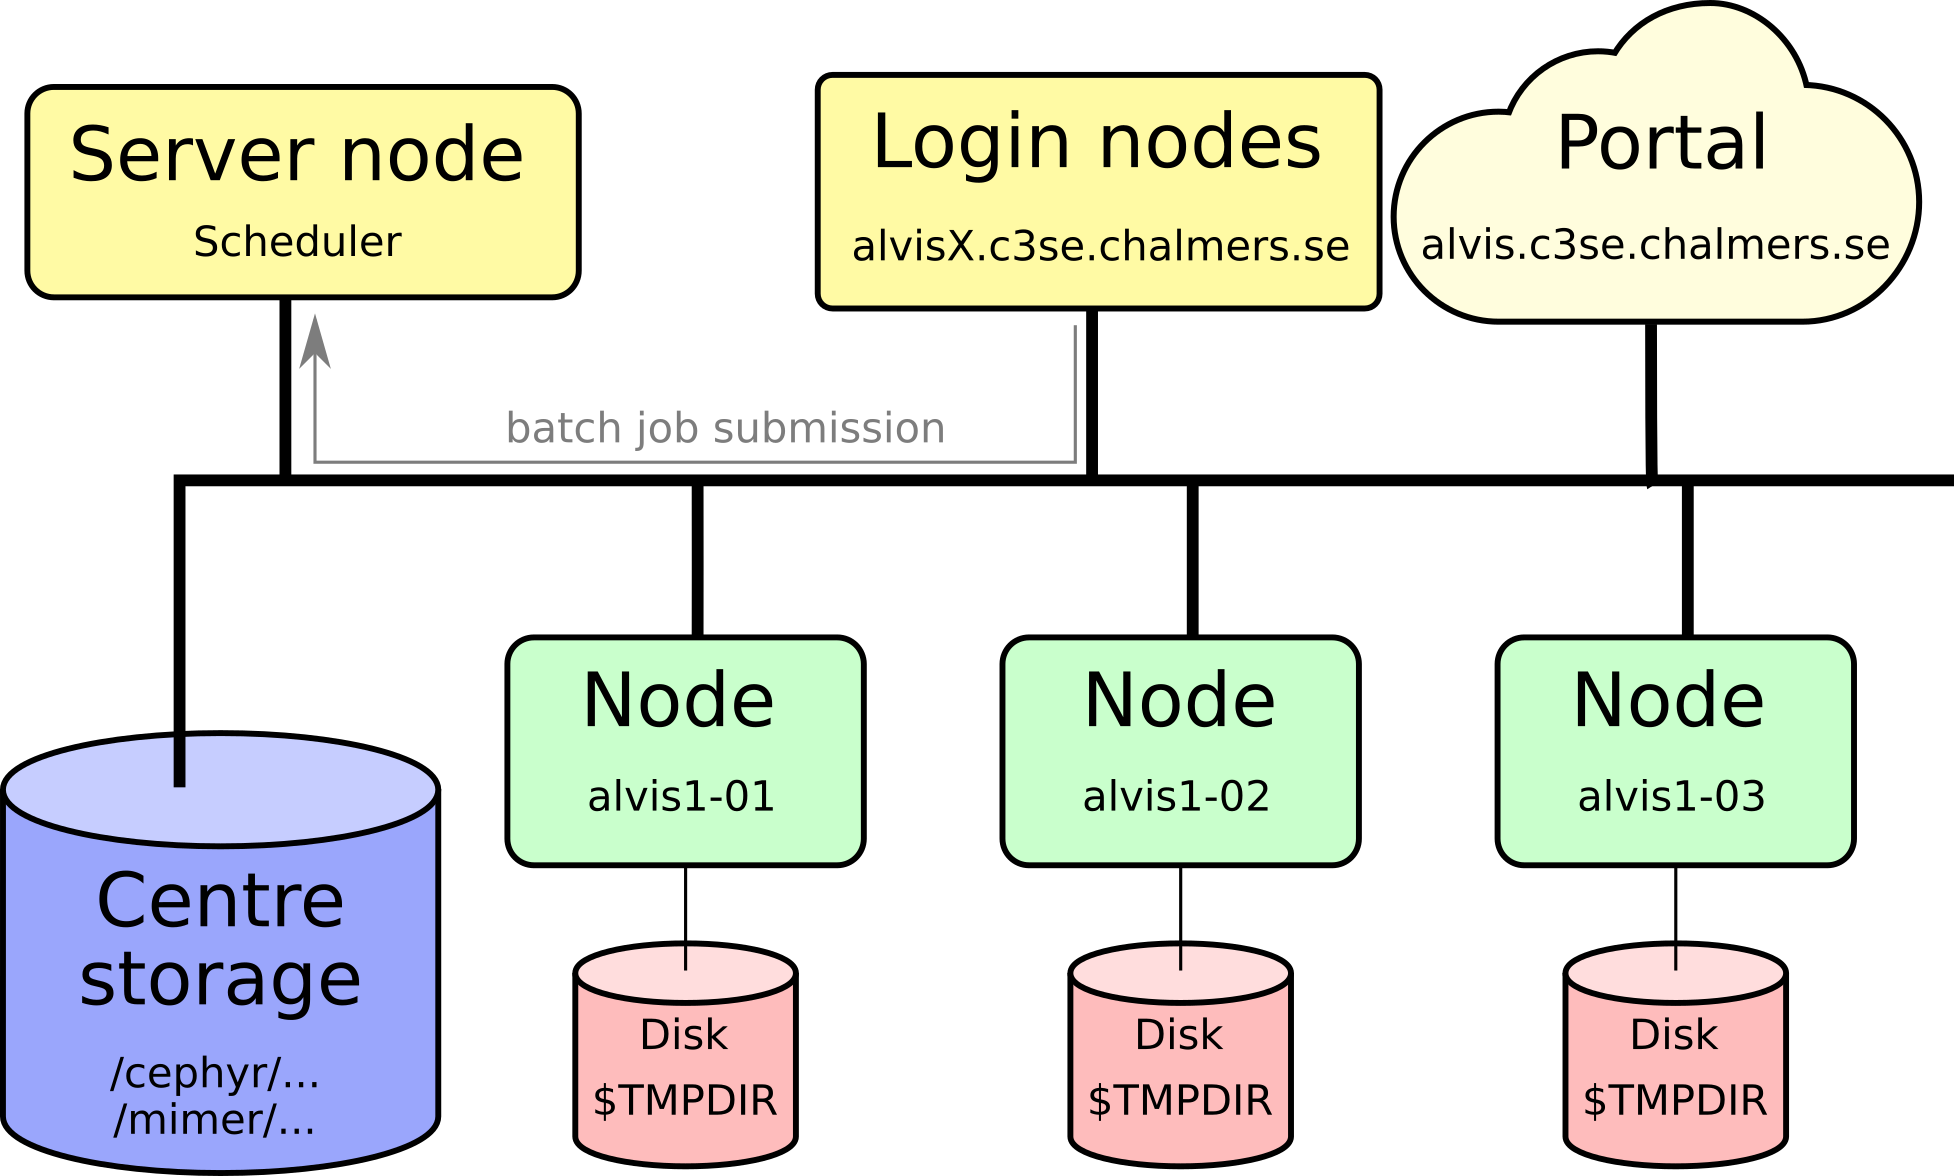
Submitting a job
Job starts
Job command overview
sbatch: submit batch jobssrun: submit interactive jobsjobinfo(squeue): view the job-queue and the state of jobs in queue, shows amount of idling resourcesscontrol show job <jobid>: show details about job, including reasons why it’s pendingsprio: show all your pending jobs and their priorityscancel: cancel a running or pending jobsinfo: show status for the partitions (queues): how many nodes are free, how many are down, busy, etc.sacct: show scheduling information about past jobsprojinfo: show the projects you belong to, including monthly allocation and usage- For details, refer to the -h flag, man pages, or Google!
Allocating GPUs on Alvis
- Specify the type of GPUs you want and the number of them per node, e.g:
#SBATCH --gpus-per-node=V100:2#SBATCH --gpus-per-node=T4:3#SBATCH --gpus-per-node=A100:1
- If you need more memory, use the constraint flag
-Cto pick the nodes with more RAM:#SBATCH --gpus-per-node=V100:2 -C 2xV100(only 2 V100 on these nodes, thus twice the RAM per gpu)#SBATCH --gpus-per-node=T4:1 -C MEM1536
- Jobs not using allocated GPUs may be terminated, to get no GPUs
#SBATCH -C NOGPU
- Many more expert options:
#SBATCH --gpus-per-node=T4:8 -N 2 --cpus-per-task=32#SBATCH -N 2 --gres=ptmpdir:1#SBATCH --gres=gpuexlc:1,mps:1
- Mixing GPUs of different types is not possible
GPU cost on Alvis
| Type | VRAM | System memory per GPU | CPU cores per GPU | Cost |
|---|---|---|---|---|
| T4 | 16GB | 72 or 192 GB | 4 | 0.35 |
| A40 | 48GB | 64 GB | 16 | 1 |
| V100 | 32GB | 192 or 384 GB | 8 | 1.31 |
| A100 | 40GB | 64 or 128 GB | 16 | 1.84 |
| A100fat | 80GB | 256 GB | 16 | 2.2 |
- Example: using 2xT4 GPUs for 10 hours costs 7 “GPU hours” (2 x 0.35 x 10).
- The cost reflects the actual price of the hardware (normalised against an A40 node/GPU).
GPU peak performance (×10¹² op/s)
| Data type | A100 | A40 | V100 | T4 |
|---|---|---|---|---|
| FP64 | 9.7 | 19.5* | 0.58 | 7.8 | 0.25 |
| FP32 | 19.5 | 37.4 | 15.7 | 8.1 |
| TF32 | 156** | 74.8** | N/A | N/A |
| FP16 | 312** | 149.7** | 125 | 65 |
| BF16 | 312** | 149.7** | N/A | N/A |
| Int8 | 624** | 299.3** | 64 | 130 |
| Int4 | 1248** | 598.7** | N/A | 260 |
- For more info around the table, see about Alvis
- For PyTorch users see performance-and-precision (tl;dr activate TF32 mixed precision on A100/A40 GPUs)
Querying visible devices
- Control groups (an OS feature) is used automatically to limit your session to the GPU you request.
- Most software tend to “just work”.
Long running jobs
- We only allow for maximum 7 days walltime.
- Anything long running should use checkpointing of some sort to save partial results.
- You will not be recompensed for aborted simulations from hardware or software errors.
Multi-node jobs
- For multi node jobs your application will need to handle all the inter-node communication, typically done with MPI.
- You may need to port your problem to a framework that supports distributed learning, e.g. Horovod
- If you can run multiple separate jobs with fewer GPUs each this is preferable for system utilisation.
- You will only be able to allocate full nodes when requesting more than one.
Example: Working with many small files
#!/usr/bin/env bash
#SBATCH -A NAISS2023-Y-X -p alvis
#SBATCH -t 1-00:00:00
#SBATCH --gpus-per-node=V100:1

unzip many_tiny_files_dataset.zip -d $TMPDIR/
apptainer exec --nv ~/tensorflow-2.1.0.sif trainer.py --training_input=$TMPDIR/
# or use available containers e.g.
# /apps/containers/TensorFlow/TensorFlow_v2.3.1-tf2-py3-GPU-Jupyter.sif- Prefer to write code that uses HDF5, netCDF, zip, tar directly.
h5pyis very easy to use.
Example: Running notebooks as batch jobs
#!/usr/bin/env bash
#SBATCH -A NAISS2024-Y-X -p alvis
#SBATCH -t 1-00:00:00
#SBATCH --gpus-per-node=A40:1

module purge
module load TensorFlow/2.15.1-foss-2023a-CUDA-12.1.1
module load IPython/8.5.0-GCCcore-11.3.0

ipython -c "%run my-notebook.ipynb"- No need to wait for job to start just to press run in the notebook.
- No extra time spent idling before and after computations.
Example: Job arrays
#!/usr/bin/env bash
#SBATCH -A NAISS2023-Y-X -p alvis
#SBATCH -t 5:00:00
#SBATCH --gpus-per-node=T4:2
#SBATCH --array=0-9
#SBATCH --mail-user=zapp.brannigan@chalmers.se --mail-type=end

module load PyTorch/2.1.2-foss-2023a-CUDA-12.1.1 h5py/3.9.0-foss-2023a
python classification_problem.py dataset_$SLURM_ARRAY_TASK_ID.hdf5- More examples are available at Running job-arrays
- Environment variables like
$SLURM_ARRAY_TASK_IDcan also be accessed from within all programming languages, e.g:
Example: Multi-node
#!/usr/bin/env bash
#SBATCH -A NAISS2023-Y-X -p alvis
#SBATCH -t 1-00:00:00
#SBATCH --gpus-per-node=T4:8
## 2 tasks across 2 nodes
#SBATCH --nodes 2 --ntasks 2

module load Horovod/0.28.1-foss-2022a-CUDA-11.7.0-TensorFlow-2.11.0

mpirun python horovod_keras_tf2_example.py- Multi-node jobs start on the first node which should then launch the rest (with
mpirun/srun). - Make sure you are using the resources you request!
- If using a container, you need to load a matching MPI from the module system
Interactive use
- Alvis is a batch queue system, you should expect a queue sometimes. Bulk of simulations should be in queued batch jobs.
- Use
jobinfoor check portal footer to find idle GPUs. - Login node allows for light interactive use; it has 4 T4 GPUs (alvis1), but they are all shared.
- Use
nvidia-smito check current usage and select your GPU number withexport CUDA_VISIBLE_DEVICES=X.`
- Use
- Login node needs to be restarted occasionally; do not make your production runs rely on the login nodes uptime!
- Several interactive apps that run on compute nodes are available through the portal.
- If needed you can run interactively on compute nodes with
srun, e.g.srun -A NAISS2023-X-Y -p alvis --gpus-per-node=T4:1 --pty bash
Jupyter Notebooks
- Jupyter Notebooks can run on login node or on compute nodes.
- Follow steps on Jupyter guide.
- Preferred way to launch interactive notebooks is via the Alvis OnDemand portal’s jupyter app.
- You can run notebooks non-interactively (e.g. in jobscripts) with
ipython -c "%run name-of-notebook-here.ipynb"
Portal
- Open OnDemand portal https://alvis.c3se.chalmers.se
- Can be used to launch notebooks, desktops etc. on nodes.
- Can be used to view your disk and project usage.
Chatbot LLM
- We provide a portal utility to qualitatively evaluate LLMs
- For bulk tasks we recommend batch jobs
- See our vLLM documentation
Monitoring and profiling
- For interactive jobs, use queue monitoring tools to see what is available
- When running jobs, use monitoring tools to check usage
- To improve your jobs profilers can be a big help
Queue monitoring
- Alvis Grafana page shows state of login node and queue.
- Alvis OnDemand footer and desktop task bar summarises available GPUs
jobinfoshows you the queue and available GPUs- Common reasons for queue status
- Priority: Waiting for other queued jobs with higher priority.
- Resources: Waiting for sufficient resources to be free.
- AssocGrpBillingRunMinutes: We limit how much you can have running at once (<= 100% of 30-day allocation * 0.5^x where x is the number of stars in
projinfo).
- Common reasons for queue status
sinfo -Rlcommand shows reason if nodes are down (typically for maintenance)scontrol show reservationshows reservations (e.g. planned maintenance)
Job and queue monitoring
job_stats.py JOBIDgives you an URL to a public Grafana page for your job usage.- You can
sshinto nodes when jobs are running, and for example runnvidia-smiorhtop.
Profiling
- With the right tools you can easily dive into where your code bottlenecks are, we recommend:
- TensorFlow: TensorBoard
- PyTorch:
torch.profiler(possibly with TensorBoard) - Python: Scalene
- Compiled CPU or GPU code: NVIDIA Nsight Systems
- MATLAB: Built in profiler
- Tools can be used interactively on compute nodes with Open OnDemand portals!
Tensorboard for profiling
- We have a Tensorboard guide
- Add a Tensorboard callback to generate logs to a job-specific directory (overlapping logs confuses Tensorboard!)
- Connecting via Alvis OnDemand (preferable), SSH tunnel or remote desktop.
- Tip: the SSH tunnel can also be used for running other services on nodes, like
code-server.
- Be aware of security, because Tensorboard offers none!
Things to keep in mind
- Never run (big or long) jobs on the login node! otherwise, the misbehaving processes will be killed by the administrators
- If this is done repeatedly, you will be logged out, and your account will temporarily be blocked
- You can however use the login node for interactively:
- Preparing your job and checking if everything’s OK before submitting the job
- Debugging a lightweight job and running tests
- You are expected to keep an eye on how your job performs especially for new jobscripts/codes!
- Command line tools available on the login node and on the allocated nodes can help you check CPU/GPU, memory and network usage
- Jobs where some or all of the allocated GPU:s are unused or very poorly utilized may be automatically terminated. We apply more stringent criteria for more expensive GPU types.
- We send warnings by email regarding poorly performing and automatically terminated jobs. Please check your spam folder if you are not seeing these emails.
Getting support
- We provide support to our users, but not for any and all problems
- We can help you with software installation issues, and recommend compiler flags etc. for optimal performance
- We can install software system-wide if there are many users who need it - but probably not for one user (unless the installation is simple)
- We don’t support your application software or help debugging your code/model or prepare your input files.
- Book a time to meet us under office hours for help with things that are hard to put into a support request email
Identifying the issue
- If you run into trouble, first figure out what seems to go wrong. Use the following as a checklist:
- make sure you simply aren’t over disk quota with
C3SE_quota - something wrong with your job script or input file?
- is there a bug in the program?
- any error messages? Look in your manuals, and use Google!
- check the metrics with
job_stats.py: Did you over-allocate memory until your program was killed? - Try to isolate the problem - does it go away if you run a smaller job? does it go away if you use your home directory instead of the local disk on the node?
- Try to create a test case - the smallest and simplest possible case that reproduces the problem
- make sure you simply aren’t over disk quota with
Error reports
- In order to help you, we need as much and as good information as possible:
- What’s the job-ID of the failing job?
- What working directory and what job-script?
- What software are you using?
- What’s happening - especially error messages?
- Did this work before, or has it never worked?
- Do you have a minimal example?
- No need to attach files; just point us to a directory on the system.
- Support cases must go through https://supr.naiss.se/support/
Further learning
- We provide a more in-depth introduction through a self-paced course
- https://chalmers.instructure.com/courses/21205/
- You can join this course with your Alvis log-in
- We try to provide a repository of example jobs and tutorials
- https://github.com/c3se/alvis-intro
- Can be used to get up and running with your first job quickly.
- Showcase useful tips and tricks which maybe even experienced users can learn from.
- Other NAISS courses are listed at https://www.naiss.se/training/