Monitoring🔗
Several tools exist for high level monitoring your jobs which should be used to verify that your job is running as intended. These tools give hints towards problem areas and bottlenecks or underutilized resources (e.g. did you use all the GPUs you requested?).
After monitoring a job you can take a deeper dive and profile the application to find out more.
Job statistics🔗
The job_stats.py command takes a Slurm job ID and returns a link to a custom Grafana dashboard:
$ job_stats.py 39375
https://scruffy.c3se.chalmers.se/d/alvis-job/alvis-job?var-jobid=39375&from=1612571366000&to=1612571370000
Note: Your job must have been started by Slurm before you run job_stats.py
The URL will take you to an interactive dashboard with real-time metrics of your running job.
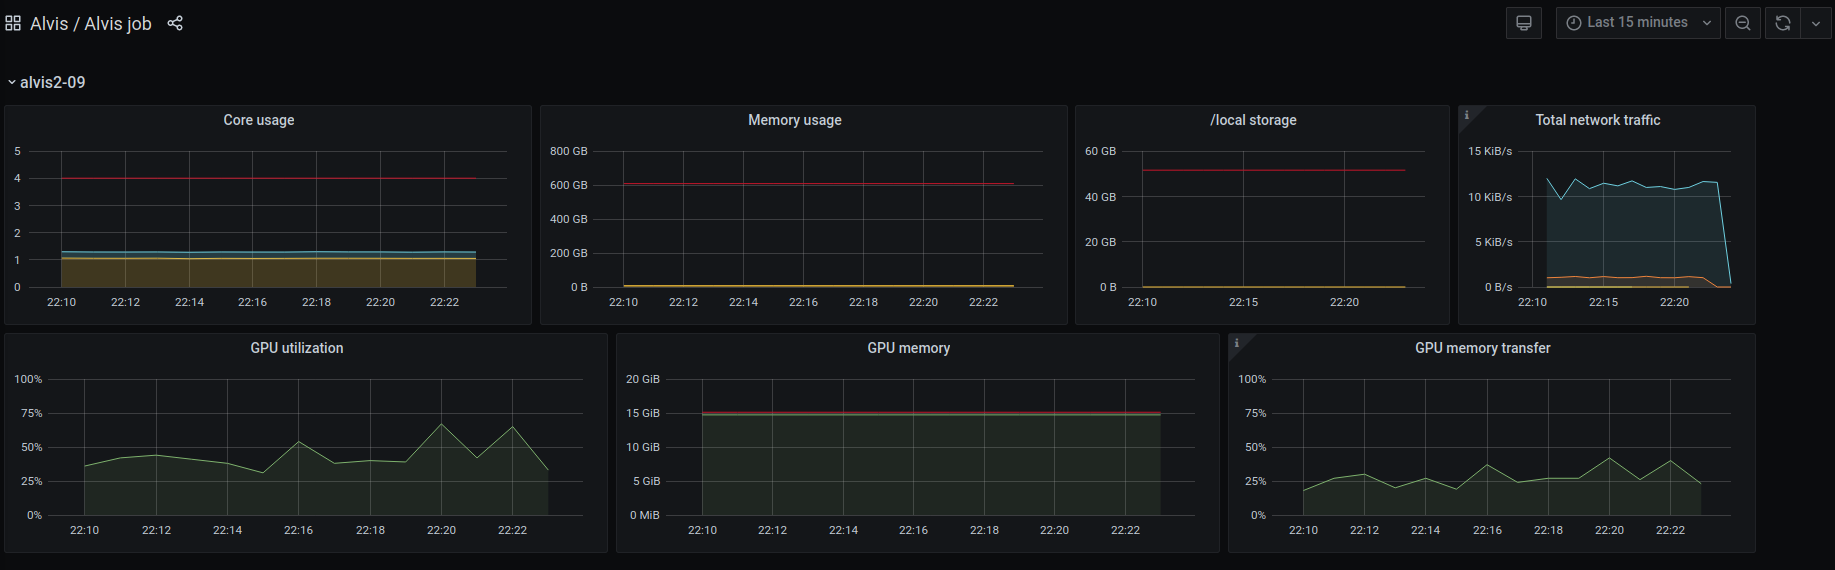
In the top right corner you can adjust the time interval. You can click and interact with each graph and highlight specific points in time.
Take special care to notice that you are actually utilizing all GPUs when you allocate several!
htop and nvtop and nvidia-smi🔗
If you ssh into the respective nodes for your job, you can use htop or nvtop commands to view CPU and GPU load respectively.
For monitoring the GPU usage you'll find recent versions of nvtop in the module system:
$ module spider nvtop
 .
.
You can also run nvidia-smi to view the current state of the GPUs, and power users could also use it for sampling metrics, e.g:
$ nvidia-smi --format=noheader,csv --query-compute-apps=timestamp,gpu_name,pid,name,used_memory --loop=1 -f sample_run.log